Diabetes Risk Analysis & Population Segmentation
Calibrated two-stage diabetes screening, clustering, and explainability on CDC BRFSS survey data
77%
At-Risk Recall
0.810
Screening ROC-AUC
0.738
Balanced Accuracy
The Problem
Diabetes affects over 37 million Americans, with an estimated 96 million more in a prediabetic state, yet early screening tools remain blunt instruments. The CDC's Behavioral Risk Factor Surveillance System (BRFSS) captures self-reported health indicators from 253,680 respondents (229,781 after deduplication) across demographics, lifestyle, and clinical factors, but the data presents serious modeling challenges. The target variable has three classes (no diabetes, prediabetes, diabetes) with severe imbalance: 83.8% of respondents report no diabetes, while prediabetes accounts for just 2% of observations. Beyond classification, public health practitioners need to understand which risk factors drive predictions and whether distinct population risk segments exist that could inform targeted intervention strategies.
Approach
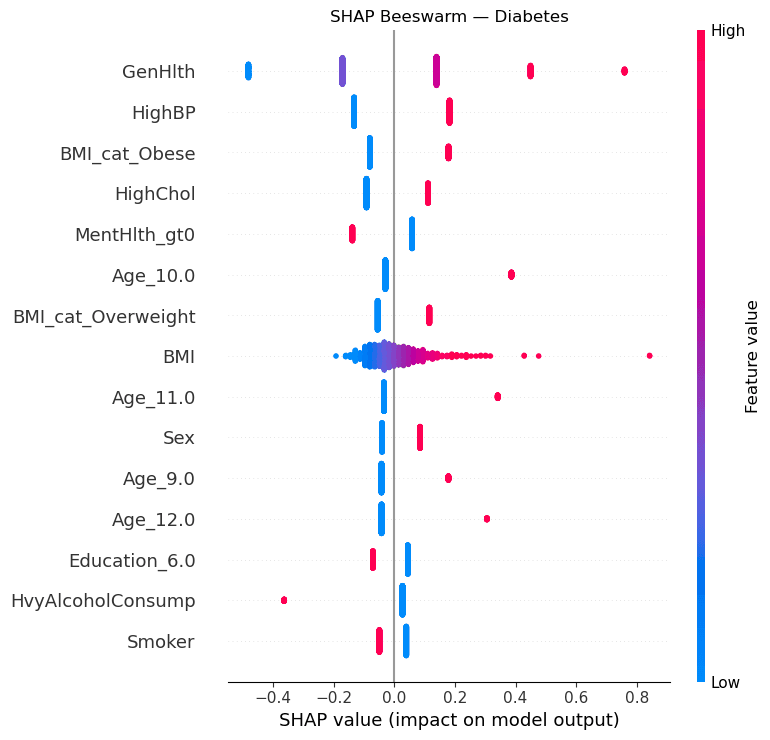
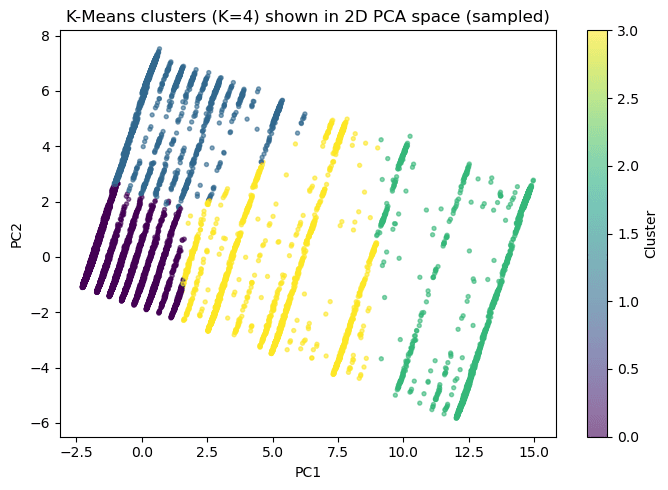
Rather than forcing a single model to handle the full three-class problem, the pipeline uses a two-stage decomposition. Stage 1 is a binary screen (at-risk vs. no diabetes) using L2-regularized logistic regression with RandomUnderSampler to address class imbalance, tuned via Optuna over 60 trials with balanced accuracy as the primary objective. Stage 2 takes the at-risk population and attempts to distinguish prediabetes from diabetes using XGBoost with RUSBoost, though this stage faces the hardest separation in the dataset. Both stages use probability calibration (sigmoid and isotonic) fitted on held-out validation data. For explainability, four complementary methods are applied: SHAP beeswarm plots for global feature attribution, LIME for local instance-level explanations, permutation importance for model-agnostic feature ranking, and logistic regression coefficients for direct interpretability. On the unsupervised side, K-Means clustering (k=4, selected via elbow and silhouette analysis) identifies population risk segments from the feature space, validated post-hoc against actual diabetes prevalence rates. DBSCAN and hierarchical clustering serve as comparison methods. Association rule mining via Apriori surfaces co-occurring risk factor patterns.
Results
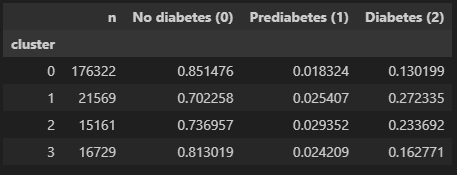
Stage 1 reached 0.810 ROC-AUC, 0.738 balanced accuracy, and 77% recall for at-risk screening on the held-out test set. K-Means found four population segments with diabetes prevalence ranging from 13.0% to 27.2% and strong stability across seeds (ARI 0.984), while SHAP and permutation importance consistently highlighted general health, high blood pressure, high cholesterol, BMI, and age as the strongest risk drivers, with clear directionality in the SHAP beeswarm (e.g., high BMI and older age push predictions toward diabetes). Prediabetes-versus-diabetes separation remained materially harder (Stage 2 balanced accuracy: 0.590; final hard-gated three-class: 0.510, vs. 0.49 for a single-model baseline), which supports positioning the project as a screening and segmentation tool rather than a diagnostic classifier. All metrics are reported on held-out test data with calibration validated separately.
Figures